Due presumably due to how disks are separate resources in Azure to Virtual machines, there is no easy way from the Metrics or Insights to view individual disk space usage.
Through a scoped Log Analytics query we can view the usage of a particular disk, or even all disks. The name of the log analytics querying syntax is Kusto
Single Disk Usage History
The bases of this query, is to pull from InsightsMetrics the extended data from the moutned disks. We then use make-series to create a series of data over the time steps required. Finally it's graphed neatly using render, in this case as a timechart.
// Set how far back to view history for
let startDate = ago(60d);
// Set the disk you want to view
let diskName = "G:";
// Run the query
InsightsMetrics
| where Origin == "vm.azm.ms"
| where Namespace == "LogicalDisk" and Name == "FreeSpacePercentage"
| extend Disk=tostring(todynamic(Tags)["vm.azm.ms/mountId"])
| where Disk == diskName
| make-series FreeSpace = min( Val ) on TimeGenerated from startDate to now() step 24h
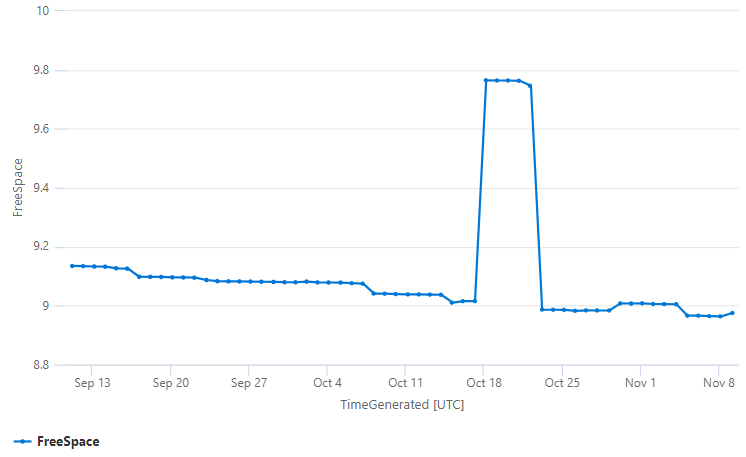
| render timechart
tip
There are some quirks in how the language queries need to be formatted. By default if you have a selection when you hit run, the selection will be run. If not, the query your cursor is on will be executed when you hit run. This is important because additional line breaks will break up queries. Comments do not count as line breaks.
Running the above query generates a nice timechart showing the data we've requested, stepped every 24-hours, and sorted/grouped appropriately.
All Disks Usage History
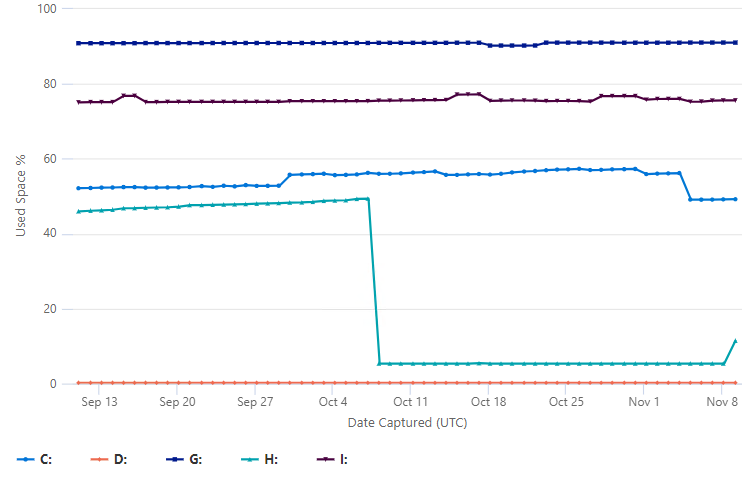
Now to further improve on this, we can query to view all disks in scope. This query doesn't have the diskName variable, and creates a make-series per Disk. It's then rendered using render timechart with some basic modifications to improve the look of the output.
// Set how far back to view history for
let startDate = ago(60d);
// Run the query
InsightsMetrics
| where Origin == "vm.azm.ms"
| where Namespace == "LogicalDisk" and Name == "FreeSpacePercentage"
| extend Disk=tostring(todynamic(Tags)["vm.azm.ms/mountId"])
| make-series UsedSpace = 100 - min( Val ) on TimeGenerated from startDate to now() step 24h by Disk
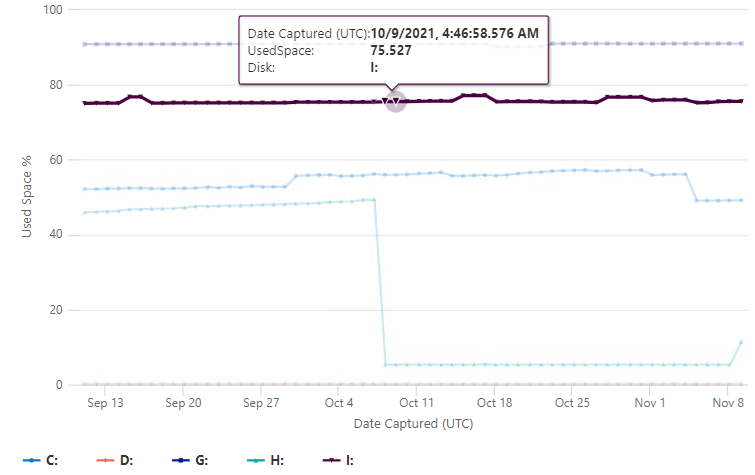
| render timechart with(ytitle = "Used Space %", xtitle = "Date Captured (UTC)")
You can also view specific datapoints by hovering over them in the graph. If you find there are too many, or too few datapoints to easily move around - adjust the step part of the make-series query.